Insulin Resistance (HOMA-IR) Calculator
Estimate insulin resistance using fasting glucose and fasting insulin values. Get HOMA-IR interpretation bands, context notes, and exportable results.
Enter your details — results appear below after you calculate.
Fasting values
Typical fasting: 70–99 mg/dL (goal ranges vary)
Also reported as mU/L — same numeric value as μU/mL
“For me” saves to My Metrics when you’re signed in. “For other” only shows results.
Clinically reviewed methodology. Last reviewed July 2026.
Editorial policy →Source links for formulas and guidance are listed in Sources & Citations below.
How this insulin resistance (HOMA-IR) calculator works
This tool estimates insulin resistance from two fasting blood tests taken on the same visit: fasting glucose and fasting insulin. It applies the widely used HOMA-IR formula—(insulin × glucose) ÷ 405 for mg/dL, or ÷ 22.5 for mmol/L—based on the homeostatic model (Matthews et al.).
You will also see an optional HOMA-β value when your glucose is high enough for the beta-cell function equation, plus a category (optimal, normal, early resistance, or significant resistance), health score, and lifestyle guidance. Scroll below the calculator for detailed articles on insulin resistance, reference tables, and FAQs.
For meaningful results, fast 8–12 hours (water only) before your blood draw, enter values exactly as printed on your lab report, and discuss results with your doctor—especially if you take insulin, steroids, or are pregnant.
Insulin Resistance (HOMA-IR) Calculator – Understand Your Metabolic Health
Insulin resistance develops when muscle, fat, and liver cells do not respond normally to insulin, so the pancreas releases more insulin to keep blood sugar stable. Over months and years, this pattern is linked to abdominal weight gain, higher triglycerides, elevated blood pressure, fatty liver, polycystic ovary syndrome (PCOS), prediabetes, and type 2 diabetes. Our Insulin Resistance (HOMA-IR) Calculator uses your fasting glucose and fasting insulin—the same inputs used in research and many clinics—to estimate insulin resistance, optional beta-cell function (HOMA-β), and practical educational guidance so you can discuss meaningful next steps with your healthcare provider.
What is Insulin Resistance?
Insulin is a hormone that helps glucose enter cells for energy or storage. When cells become less responsive, the body compensates by producing more insulin. You may still have normal fasting glucose for a while because insulin is “working harder” in the background. HOMA-IR captures that hidden strain by combining fasting glucose and fasting insulin into a single index.
1Key Components of a HOMA-IR Assessment
Laboratory Markers
- Fasting plasma glucose (mg/dL or mmol/L)
- Fasting insulin (μU/mL, same as mU/L)
- Optional: HbA1c, fasting lipid panel
- Optional: C-peptide for complementary insight
Clinical & Lifestyle Context
- Waist circumference and body weight trends
- Family history of diabetes or heart disease
- Physical activity, sleep, and stress levels
- Medications that affect glucose or insulin
2How HOMA-IR and HOMA-β Are Calculated
HOMA-IR
(Fasting insulin × Fasting glucose) ÷ 405 — glucose in mg/dL
(Fasting insulin × Fasting glucose) ÷ 22.5 — glucose in mmol/L
Developed from the homeostasis model (Matthews et al.), HOMA-IR is widely used in epidemiology and clinical research to estimate insulin resistance from routine fasting labs.
HOMA-β
(360 × Fasting insulin) ÷ (Fasting glucose − 63) — glucose in mg/dL
HOMA-β approximates beta-cell secretory capacity. It is reported when fasting glucose is above the model threshold. Interpret alongside HOMA-IR and clinical history.
Related Indices (for your clinician)
QUICKI, TyG index, and oral glucose tolerance tests may provide additional perspectives. HOMA-IR remains one of the most common fasting-based screening tools in metabolic research.
Factors That Influence Insulin Resistance
HOMA-IR reflects biology, behavior, and environment. Understanding these factors helps you interpret a single lab snapshot and build a sustainable plan with your care team.
| Factor | Effect on Insulin Resistance | Practical Approaches |
|---|---|---|
| Excess visceral fat | Increases insulin demand and inflammatory signaling | Modest weight loss, resistance training, protein-forward meals |
| Sedentary lifestyle | Reduces muscle glucose uptake | 150+ min/week activity; add post-meal walks |
| Poor sleep (<7 h) | Alters cortisol and hunger hormones | Consistent sleep schedule, limit late screens |
| Chronic stress | Raises cortisol and hepatic glucose output | Mindfulness, counseling, manageable workload |
| Ultra-processed diet | Rapid glucose spikes, high insulin exposure | More fiber, whole foods; limit sugary drinks |
| Genetics & family history | Predisposition to higher HOMA-IR | Earlier screening, proactive lifestyle measures |
Benefits of Knowing Your HOMA-IR
- Earlier awareness – Detect compensatory hyperinsulinemia before fasting glucose or HbA1c rise into diabetic ranges.
- Track lifestyle impact – Compare values over time after nutrition, activity, or weight changes.
- Guide discussions – Bring objective numbers to appointments about PCOS, prediabetes, or metabolic syndrome.
- Holistic risk picture – Pair with blood pressure, lipids, and waist circumference for cardiovascular prevention.
- Motivation for change – Quantified feedback can reinforce sustainable habits between lab visits.
How to Use This HOMA-IR Calculator
- Get fasting labs – Request fasting glucose and fasting insulin on the same blood draw (8–12 hour fast, water only).
- Choose correct units – Enter glucose as mg/dL or mmol/L exactly as printed on your report; insulin in μU/mL.
- Calculate – Review HOMA-IR, category, optional HOMA-β, and educational recommendations.
- Compare trends – Save results and recheck after lifestyle changes, typically every 3–6 months if advised.
- Consult your clinician – Discuss interpretation, additional tests, and treatment options tailored to you.
Strategies to Improve Insulin Sensitivity
Immediate Actions (This Week)
- Remove sugary drinks and limit refined snacks
- Walk 10–15 minutes after main meals
- Prioritize 7–9 hours of sleep on a regular schedule
- Include protein and fiber at breakfast
- Log waist circumference and weight for baseline
- Book follow-up labs if HOMA-IR was elevated
Long-Term Habits (1–3 Months+)
- Resistance training 2–3 times per week
- Mediterranean-style or high-fiber meal patterns
- 5–10% body weight loss if overweight (clinician-guided)
- Stress reduction practices you will maintain
- Monitor blood pressure and lipids annually
- Work with a dietitian or diabetes educator if referred
Understanding Your HOMA-IR Results
HOMA-IR < 2.0
Often interpreted as normal or good insulin sensitivity in many populations. Maintain balanced nutrition, regular activity, and routine checkups—especially if you have family history or other risk factors.
HOMA-IR 2.0 – 2.9
May suggest early insulin resistance. Consider lifestyle optimization and discuss repeat fasting labs, HbA1c, lipids, and blood pressure with your provider.
HOMA-IR ≥ 2.9
Frequently associated with significant insulin resistance and higher metabolic risk. Prompt medical review is recommended to evaluate prediabetes, type 2 diabetes, PCOS, or cardiovascular risk and to plan treatment if needed.
Typical Fasting Reference Ranges (Educational)
| Marker | Often cited range | Notes |
|---|---|---|
| Fasting glucose | 70–99 mg/dL (3.9–5.5 mmol/L) | Goals differ in diabetes care |
| Fasting insulin | ~2–12 μU/mL (lab-specific) | Assay method affects values |
| HOMA-IR | < 2.0 often “normal” | Population cutoffs vary |
Common Mistakes When Using HOMA-IR
1. Using non-fasting blood samples
HOMA-IR is validated for fasting labs. Even a small breakfast before the draw can raise glucose and insulin and produce misleadingly high scores.
2. Mixing units or lab reports
Enter glucose in the same unit shown on your report (mg/dL vs mmol/L). Do not combine insulin from one date with glucose from another.
3. Ignoring context (illness, steroids, pregnancy)
Acute infection, corticosteroids, and pregnancy alter metabolism. Defer interpretation until your clinician confirms stable conditions.
4. Treating one number as a diagnosis
A single HOMA-IR should not label you “diabetic” or “healthy” without full clinical assessment, symptoms, and repeat testing when indicated.
The Science Behind HOMA-IR
The homeostatic model assumes a balance between hepatic glucose output, peripheral glucose uptake, and insulin secretion. By modeling fasting steady state, HOMA-IR estimates resistance at the liver and periphery and has been validated against clamp studies in research settings—though clamp testing remains the research gold standard and is not used in routine care.
Insulin’s Role
- Signals cells to absorb glucose after meals
- Suppresses liver glucose release between meals
- Promotes fat storage when intake exceeds need
- Elevated fasting levels suggest compensatory strain
Metabolic Syndrome Link
- Central obesity and high waist circumference
- Elevated triglycerides, low HDL
- High blood pressure
- Impaired fasting glucose or insulin resistance
Who Should Discuss HOMA-IR
- Family history of type 2 diabetes
- PCOS, gestational diabetes history
- Persistent borderline fasting glucose
- Rapid weight gain around the abdomen
Additional Labs to Consider
- HbA1c and fasting lipid panel
- Liver enzymes (NAFLD screening)
- Thyroid function if clinically indicated
- Urine albumin if hypertension or diabetes
Nutrition & Activity Tips by Risk Level
Maintenance (HOMA-IR < 2)
- Balanced plates: half vegetables, quarter protein, quarter whole grains
- 150 minutes moderate cardio weekly
- Limit alcohol and ultra-processed foods
- Annual metabolic labs if at risk
Active improvement (HOMA-IR ≥ 2)
- Emphasize legumes, vegetables, nuts, and whole grains
- Time carbohydrates around activity when possible
- Progressive resistance training for muscle glucose uptake
- Medical nutrition therapy if recommended
Frequently Asked Questions (FAQs)
Related Calculators
You might also be interested in these related health and wellness calculators:
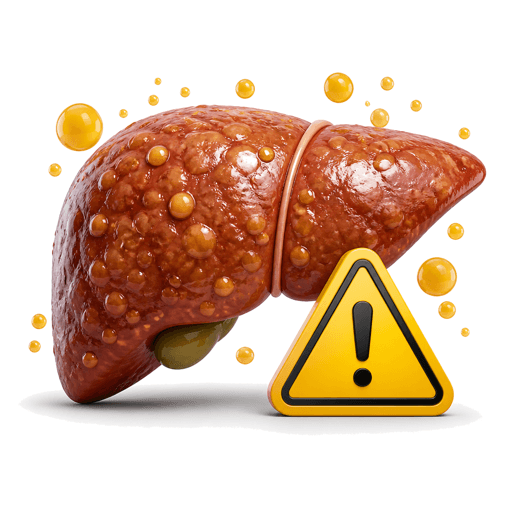
Fatty Liver Risk Calculator
Assess NAFLD/MASLD fatty liver risk from BMI, waist, diabetes, diet, alcohol and lifestyle. Get weight-loss targets, diet tips, exercise guidance, and liver test recommendations.
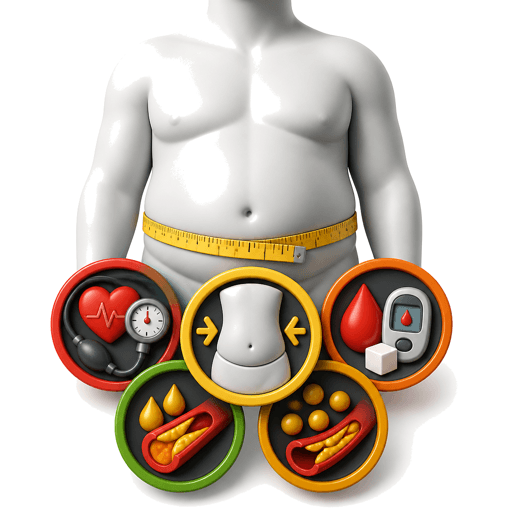
Metabolic Syndrome Risk Calculator
Screen metabolic syndrome with all 5 harmonized criteria—waist, triglycerides, HDL, blood pressure and fasting glucose. Asian waist cutoffs, diet tips, exercise guidance and lab recommendations.
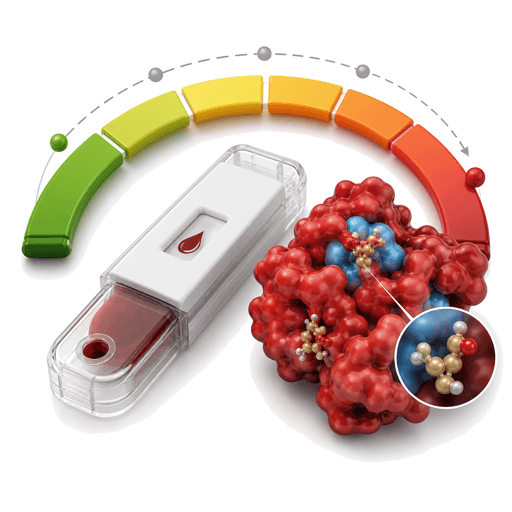
HbA1c ↔ Average Blood Glucose Calculator
Convert HbA1c (%) to estimated average glucose (eAG) and back using the ADAG formula. ADA category bands, mg/dL and mmol/L units, PDF export.

Type 2 Diabetes Risk Assessment Calculator
Assess type 2 diabetes risk using the Indian Diabetes Risk Score (IDRS). Enter age, waist, family history, activity, and clinical history. Low to Very High risk with PDF export.

Polycystic Ovary Syndrome Risk Calculator
Screen for polycystic ovary syndrome (PCOS) using cycle irregularity, androgen symptoms, BMI, metabolic signs, and family history. Educational risk score—not a diagnosis.
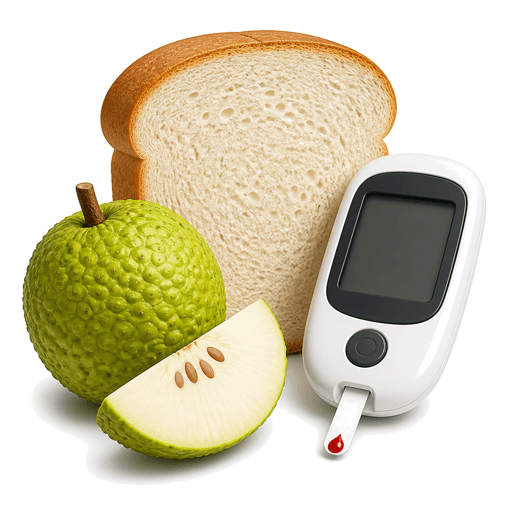
Glycemic Load Calculator
Calculate meal glycemic load from GI and carb portions—compare to diabetes & weight-loss targets, 30+ Indian food presets, lower-GL swaps, pairing tips, and PDF export.

Triglyceride/HDL Ratio Calculator
Calculate triglyceride/HDL ratio from fasting lipids for cardiometabolic risk, insulin resistance screening, AHA lipid interpretation, and PDF export.

Atherogenic Index of Plasma (AIP) Calculator
Calculate AIP (log₁₀ TG/HDL in mmol/L) from fasting lipids for log-based atherogenic risk, Dobiášová classification, insulin resistance screening, and PDF export.
Calculator Categories
Explore more free tools by health topic. Your calculator's category is highlighted below.
Heart & Metabolic Health
23 calculators
Browse categoryNutrition & Metabolism
31 calculators
Browse categoryBody Composition
16 calculators
Browse categoryFitness & Cardio
13 calculators
Browse categorySleep & Circadian Health
6 calculators
Browse categoryAging & Longevity
6 calculators
Browse categoryMental Wellbeing
4 calculators
Browse categoryWomen's Health
10 calculators
Browse categoryEnvironment & Lifestyle
6 calculators
Browse category